Docker for Mac 環境で簡単に ELK Stack をビルドする2
先ポスト Docker for Mac 環境で簡単に ELK Stack をビルドする1 からの続きです。 バッチ処理のように静的なファイルを読み込んで可視化するところまで行います。 使ったサンプルはこちら logstash tutorial
Logstash の動作確認つづき
試しに Apache のログを読み込むための、.conf ファイルを作ります。
vi apache-import.conf
cat conf/apache-import.conf
input {
  stdin { }
}

filter {
  grok {
  match => { "message" => "%{COMBINEDAPACHELOG}" }
  }
  date {
  match => [ "timestamp" , "dd/MMM/yyyy:HH:mm:ss Z" ]
  locale => "en"
  }
  mutate {
  replace => { "type" => "apache_access" }
  }
}

output {
  # stdout { codec => rubydebug }
  elasticsearch { hosts => 'localhost:9200' }
}
conf ファイルのテスト
config test をして、正しく動く .conf かテストします。
root@38ef067ec9de:/opt# ./logstash/bin/logstash -f conf/apache-import.conf -t
Sending Logstash's logs to /opt/logstash/logs which is now configured via log4j2.properties
Configuration OK
[2017-01-25T11:07:08,155][INFO ][logstash.runner          ] Using config.test_and_exit mode. Config Validation Result: OK. Exiting Logstash
ローカルの静的なファイル読み込む動作
root@38ef067ec9de:/opt# ./logstash/bin/logstash -f conf/apache-import.conf < testapache.log
Sending Logstash's logs to /opt/logstash/logs which is now configured via log4j2.properties
[2017-01-25T11:09:49,418][INFO ][logstash.outputs.elasticsearch] Elasticsearch pool URLs updated {:changes=>{:removed=>[], :added=>["http://localhost:9200"]}}
[2017-01-25T11:09:49,424][INFO ][logstash.outputs.elasticsearch] Running health check to see if an Elasticsearch connection is working {:url=>#<URI::HTTP:0x529840a6 URL:http://localhost:9200>, :healthcheck_path=>"/"}
[2017-01-25T11:09:49,550][WARN ][logstash.outputs.elasticsearch] Restored connection to ES instance {:url=>#<URI::HTTP:0x529840a6 URL:http://localhost:9200>}
[2017-01-25T11:09:49,552][INFO ][logstash.outputs.elasticsearch] Using mapping template from {:path=>nil}
[2017-01-25T11:09:49,622][INFO ][logstash.outputs.elasticsearch] Attempting to install template {:manage_template=>{"template"=>"logstash-*", "version"=>50001, "settings"=>{"index.refresh_interval"=>"5s"}, "mappings"=>{"_default_"=>{"_all"=>{"enabled"=>true, "norms"=>false}, "dynamic_templates"=>[{"message_field"=>{"path_match"=>"message", "match_mapping_type"=>"string", "mapping"=>{"type"=>"text", "norms"=>false}}}, {"string_fields"=>{"match"=>"*", "match_mapping_type"=>"string", "mapping"=>{"type"=>"text", "norms"=>false, "fields"=>{"keyword"=>{"type"=>"keyword"}}}}}], "properties"=>{"@timestamp"=>{"type"=>"date", "include_in_all"=>false}, "@version"=>{"type"=>"keyword", "include_in_all"=>false}, "geoip"=>{"dynamic"=>true, "properties"=>{"ip"=>{"type"=>"ip"}, "location"=>{"type"=>"geo_point"}, "latitude"=>{"type"=>"half_float"}, "longitude"=>{"type"=>"half_float"}}}}}}}}
[2017-01-25T11:09:49,632][INFO ][logstash.outputs.elasticsearch] Installing elasticsearch template to _template/logstash
[2017-01-25T11:09:49,749][INFO ][logstash.outputs.elasticsearch] New Elasticsearch output {:class=>"LogStash::Outputs::ElasticSearch", :hosts=>["localhost:9200"]}
[2017-01-25T11:09:49,881][INFO ][logstash.pipeline        ] Starting pipeline {"id"=>"main", "pipeline.workers"=>4, "pipeline.batch.size"=>125, "pipeline.batch.delay"=>5, "pipeline.max_inflight"=>500}
[2017-01-25T11:09:49,883][INFO ][logstash.pipeline        ] Pipeline main started
[2017-01-25T11:09:50,379][INFO ][logstash.agent           ] Successfully started Logstash API endpoint {:port=>9601}
[2017-01-25T11:09:52,898][WARN ][logstash.agent           ] stopping pipeline {:id=>"main"}
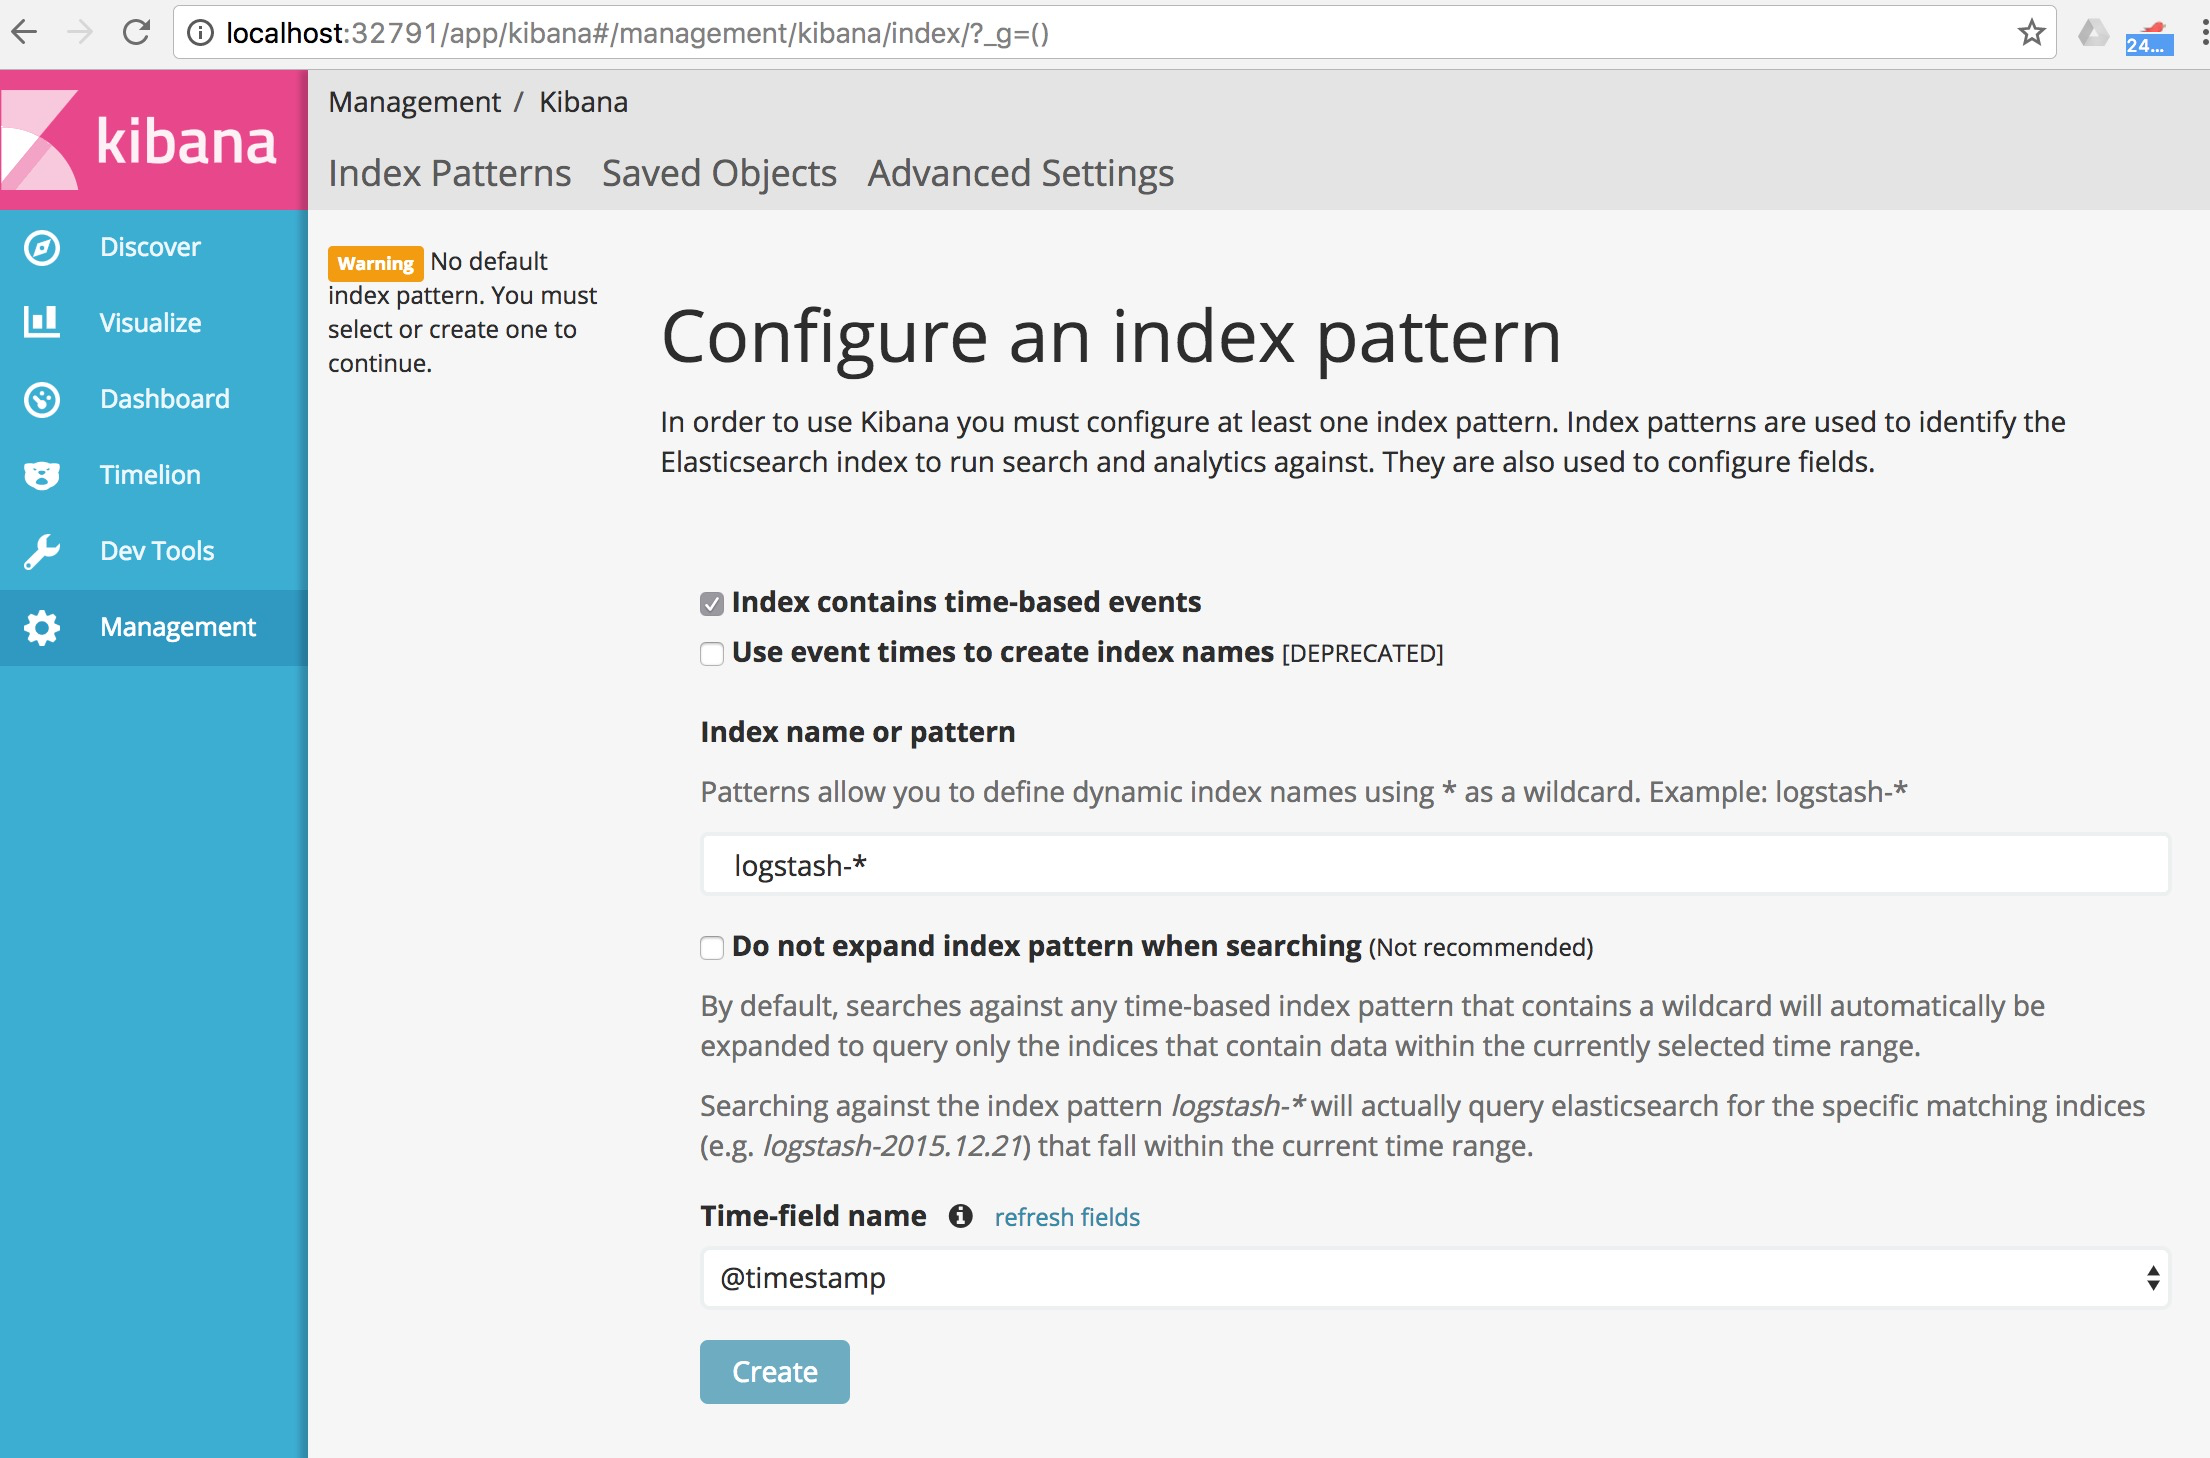
Kibana から index の確認
Kibana から見てみます。ただしくパースされていると、Create が押せるようになっています。
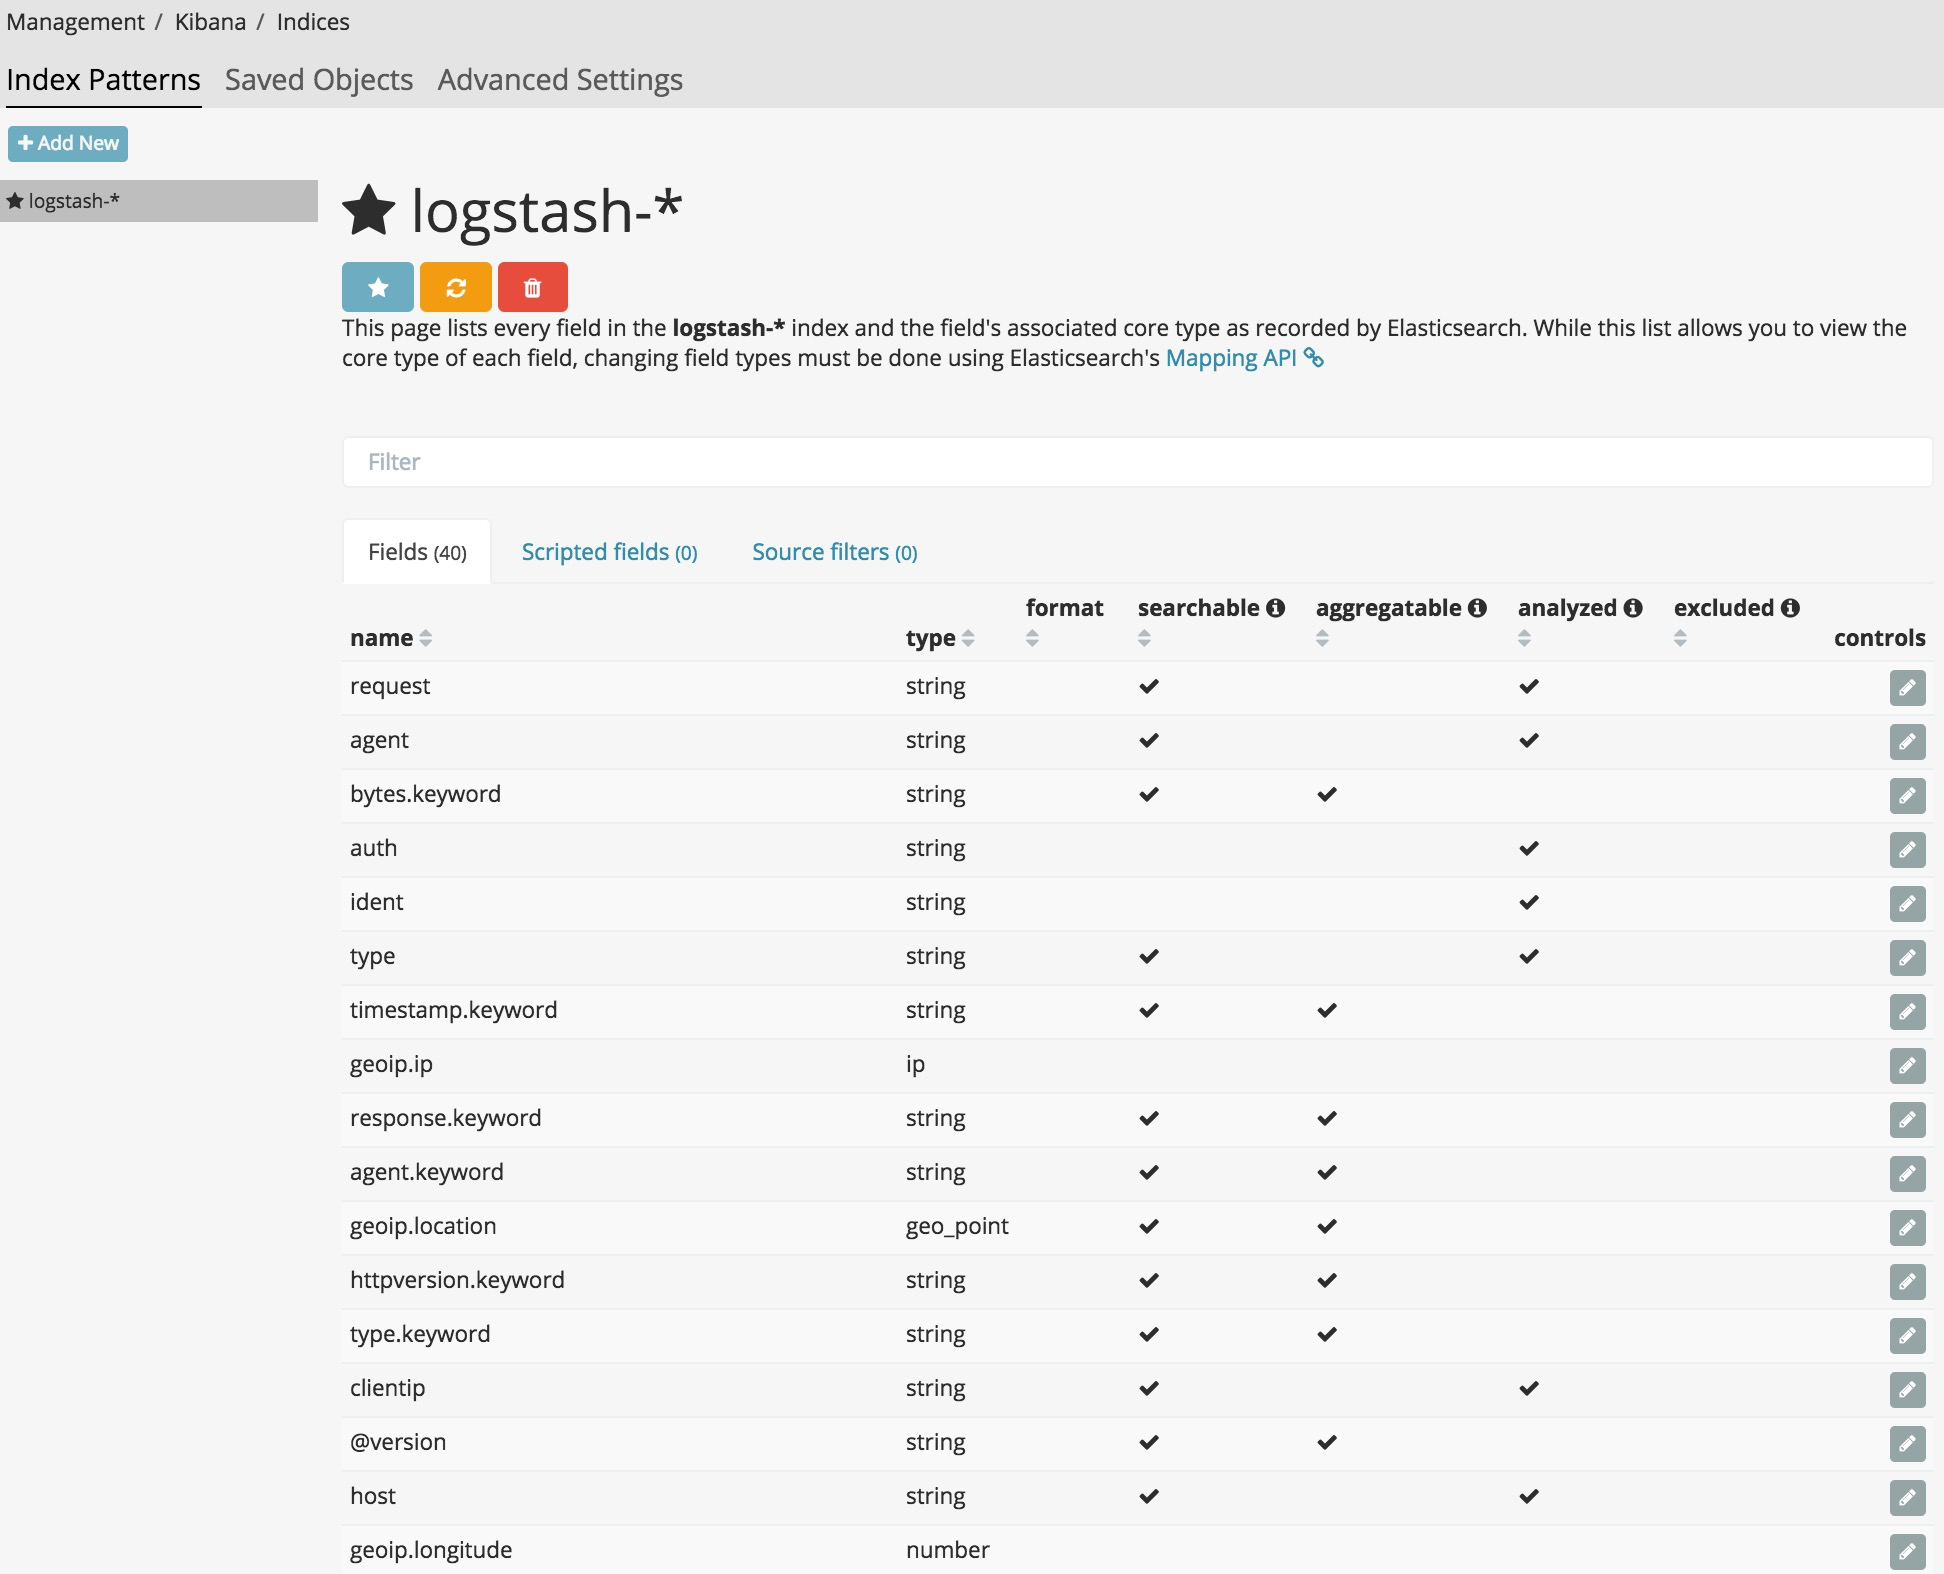
このように、パースされたフィールドとその type が一覧で出てきます。
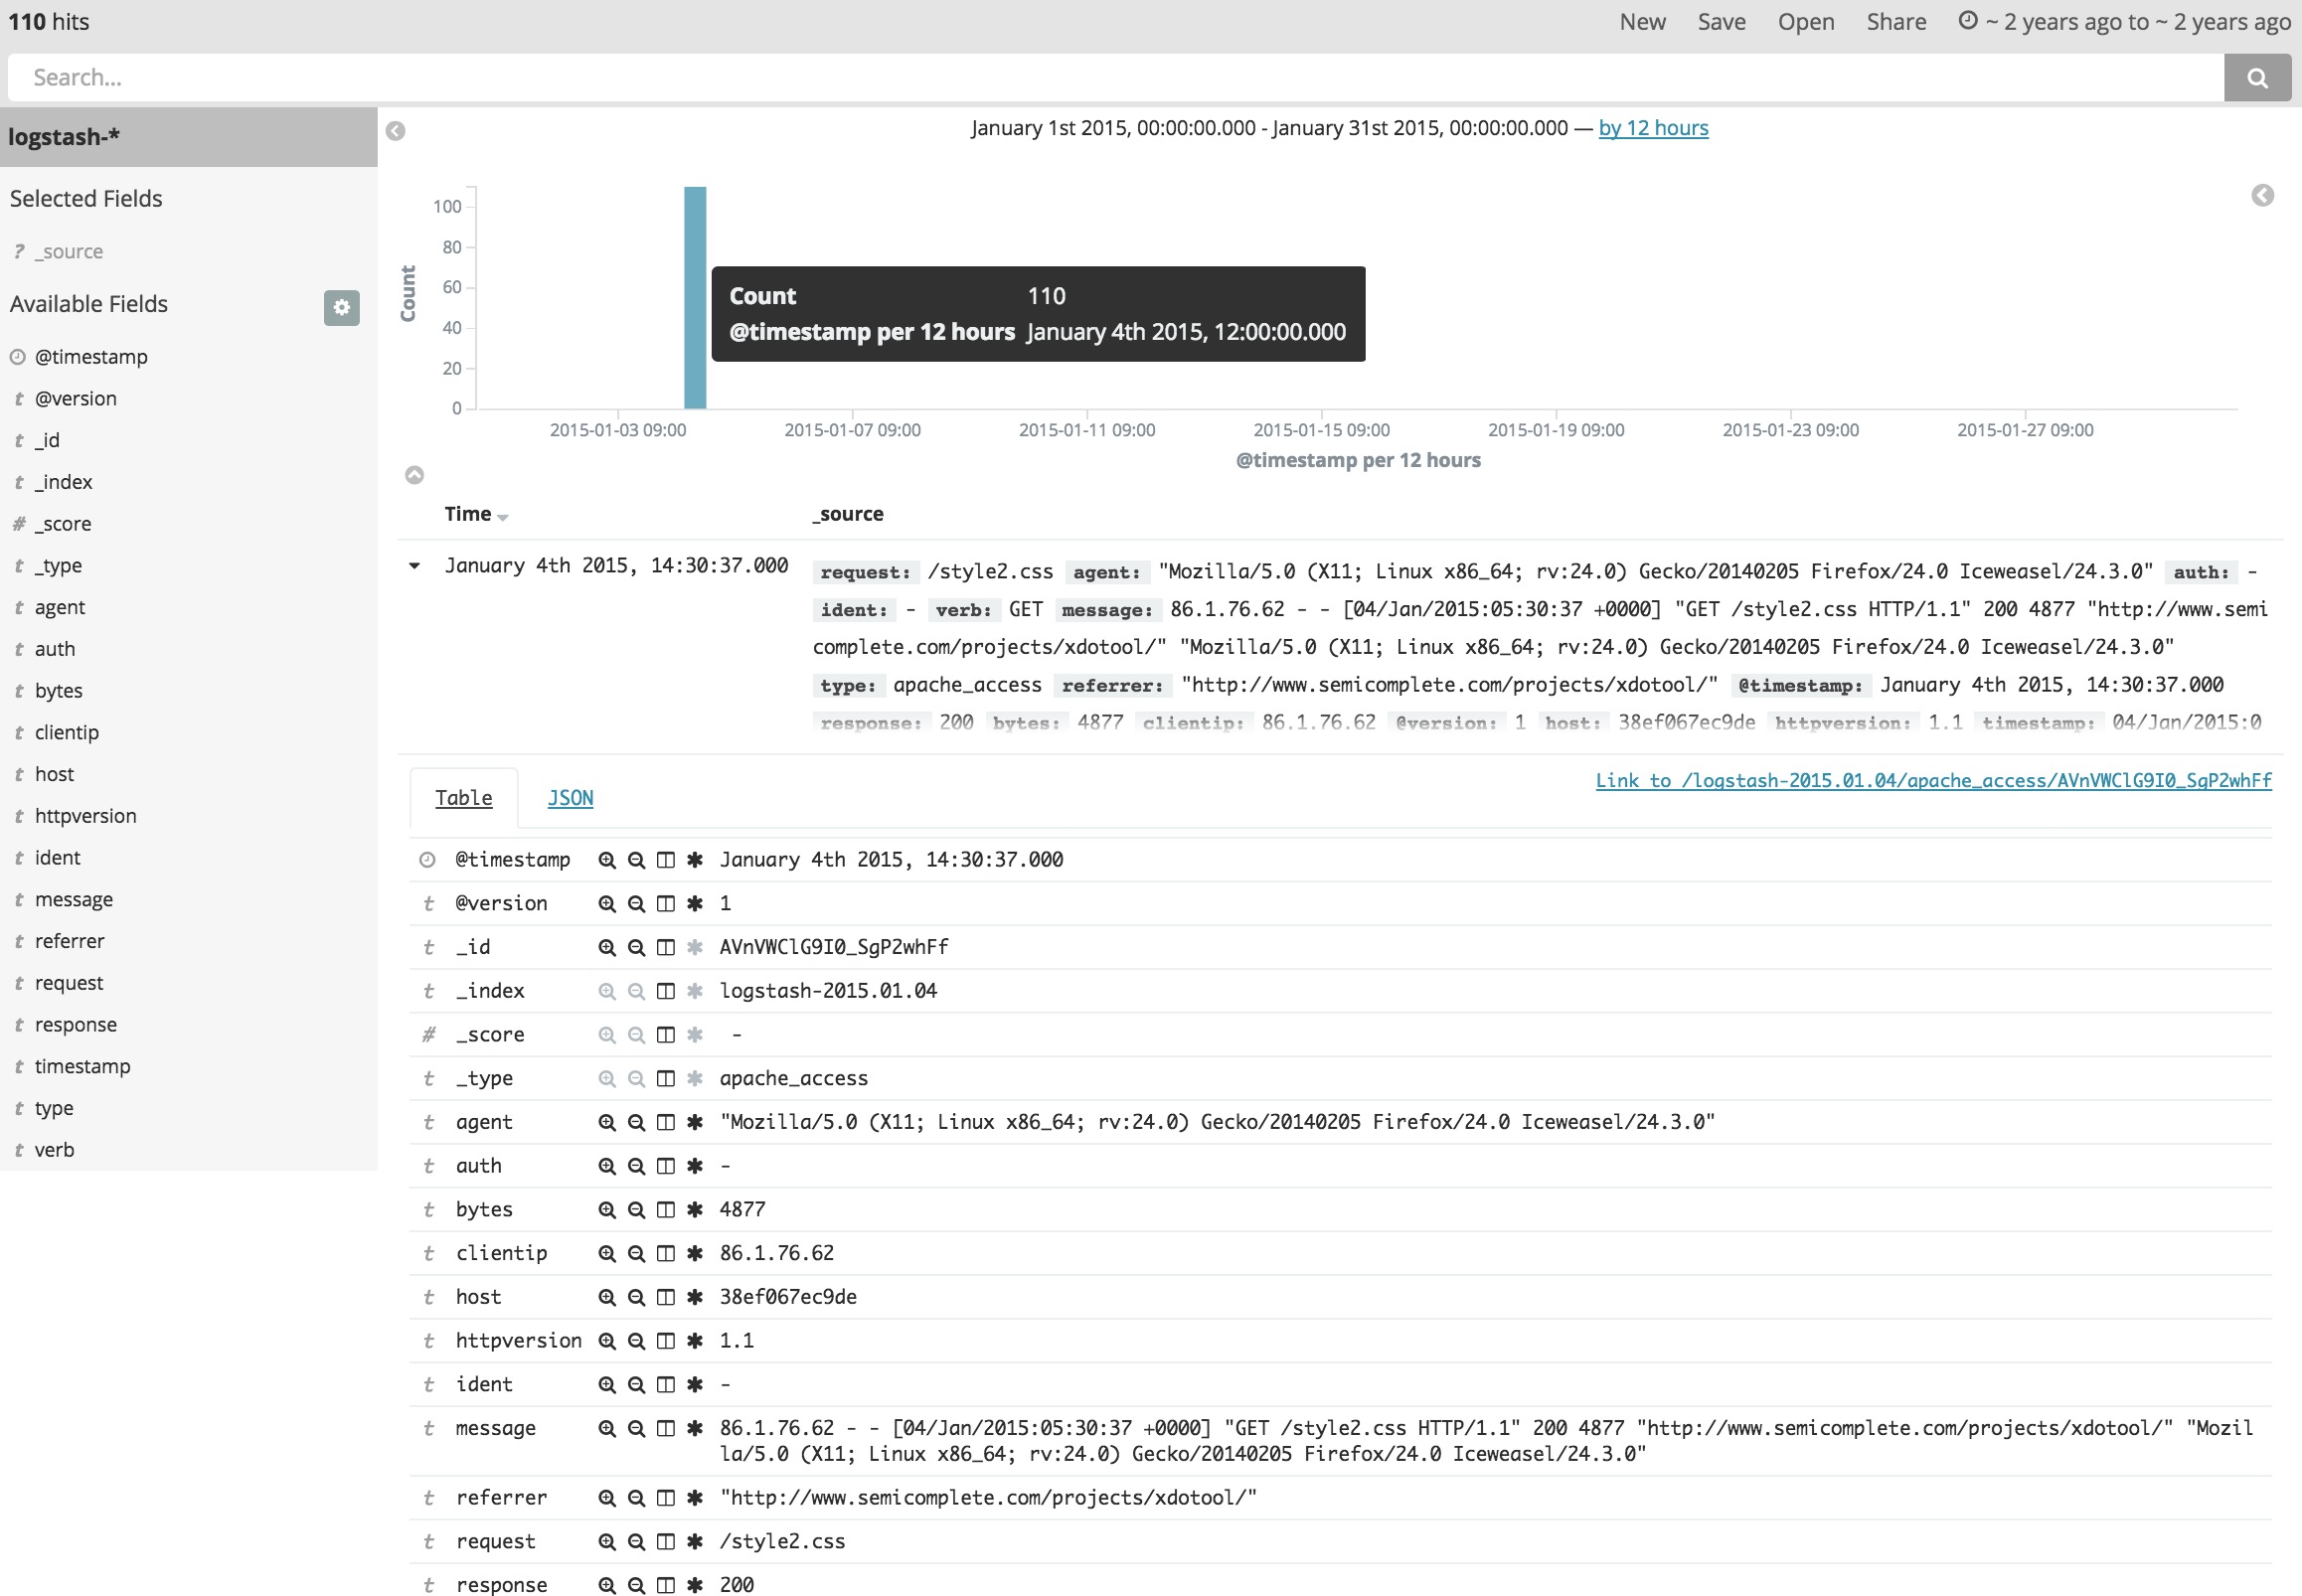
次に、左タブのDiscoverに移動し、右上の Timerang でLast 5 yearsを選びます。
(注意)今回サンプルに用いたログが logstash tutorialから拝借したため、@timestamp が 2015年1月と古いためです。
各ログ一つ一つのフィールドと中身が見えてきます。
Kibana でのお手軽な可視化
これらの情報をグラフにしていきます。左タブから、Visualize>Pie chartを選んでみます。
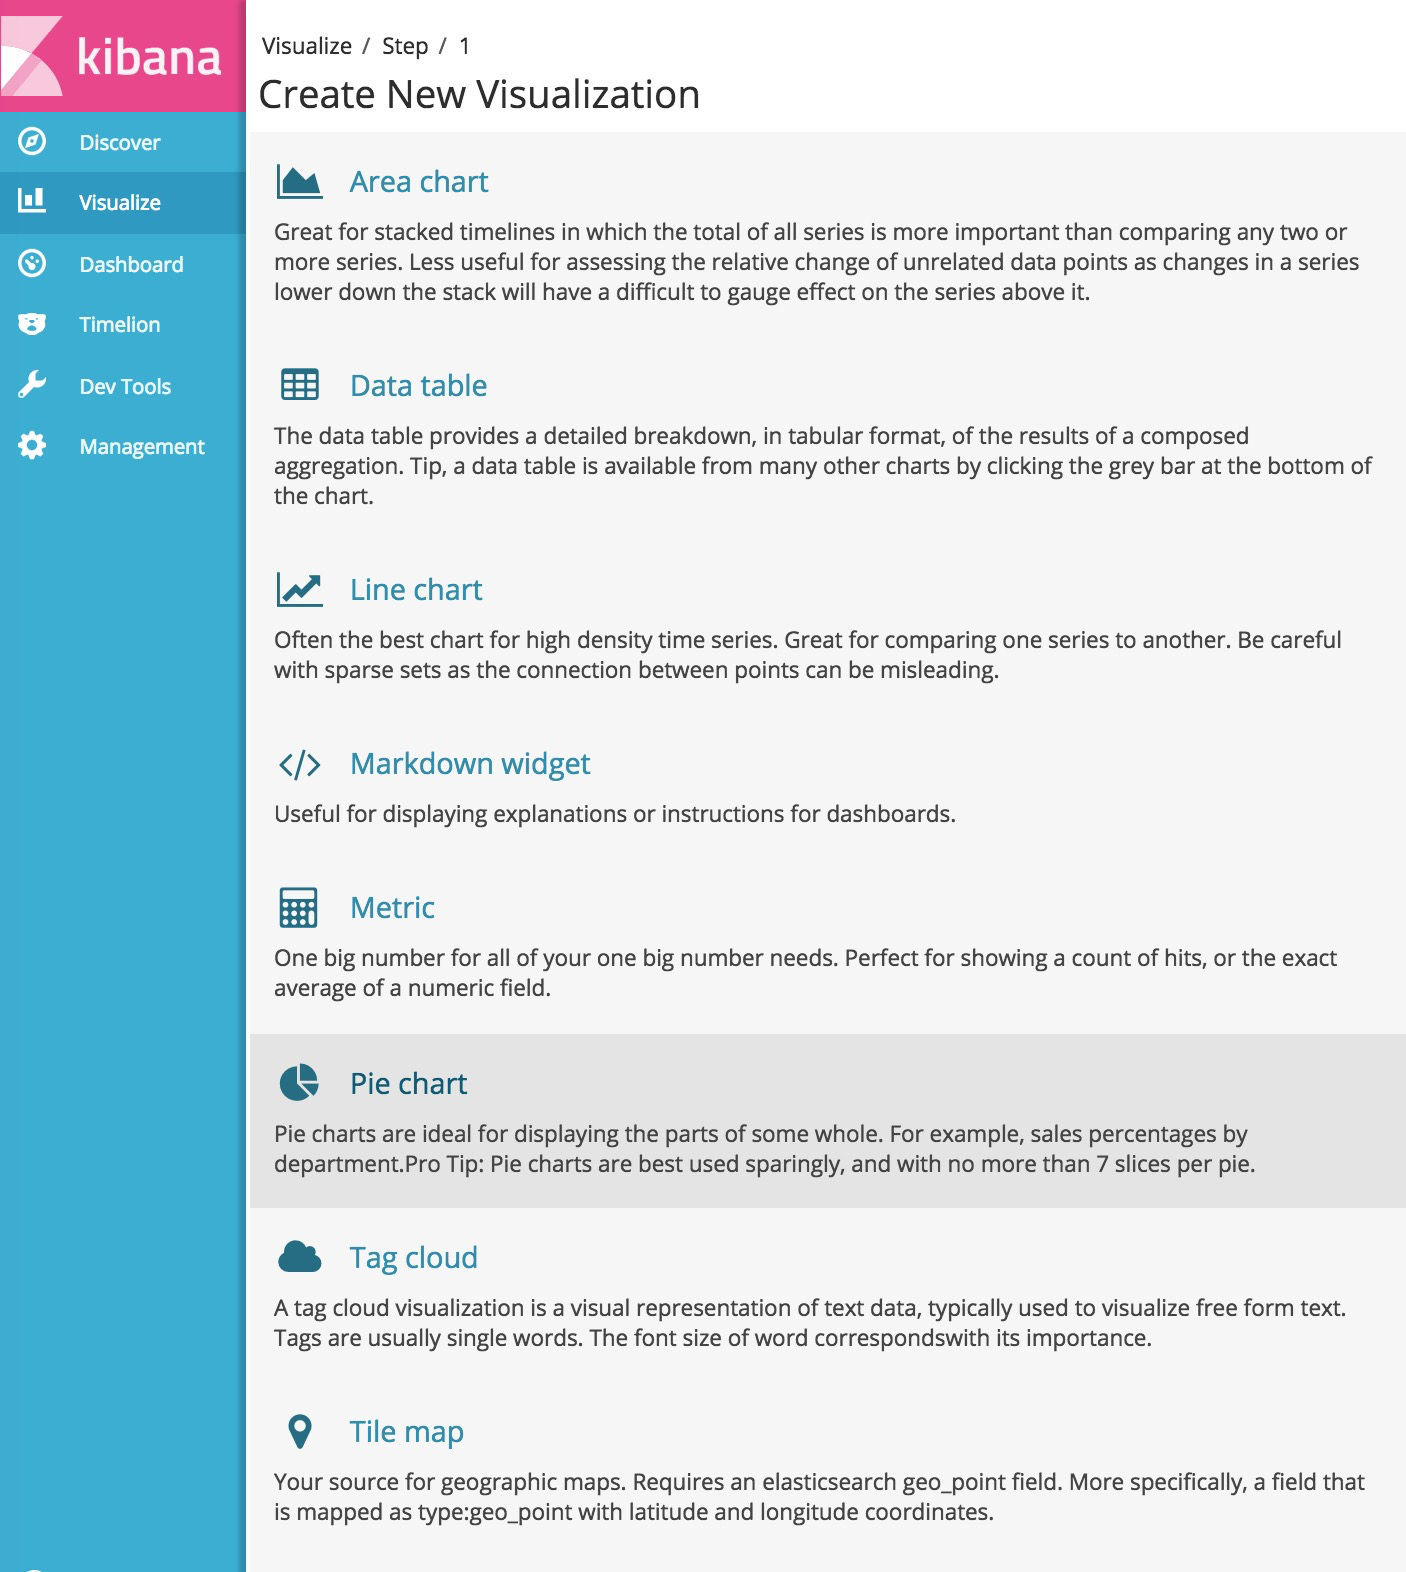
でーんと円グラフが出てきます。
* でフィルタしているためこの time range の全てのログが対象です。
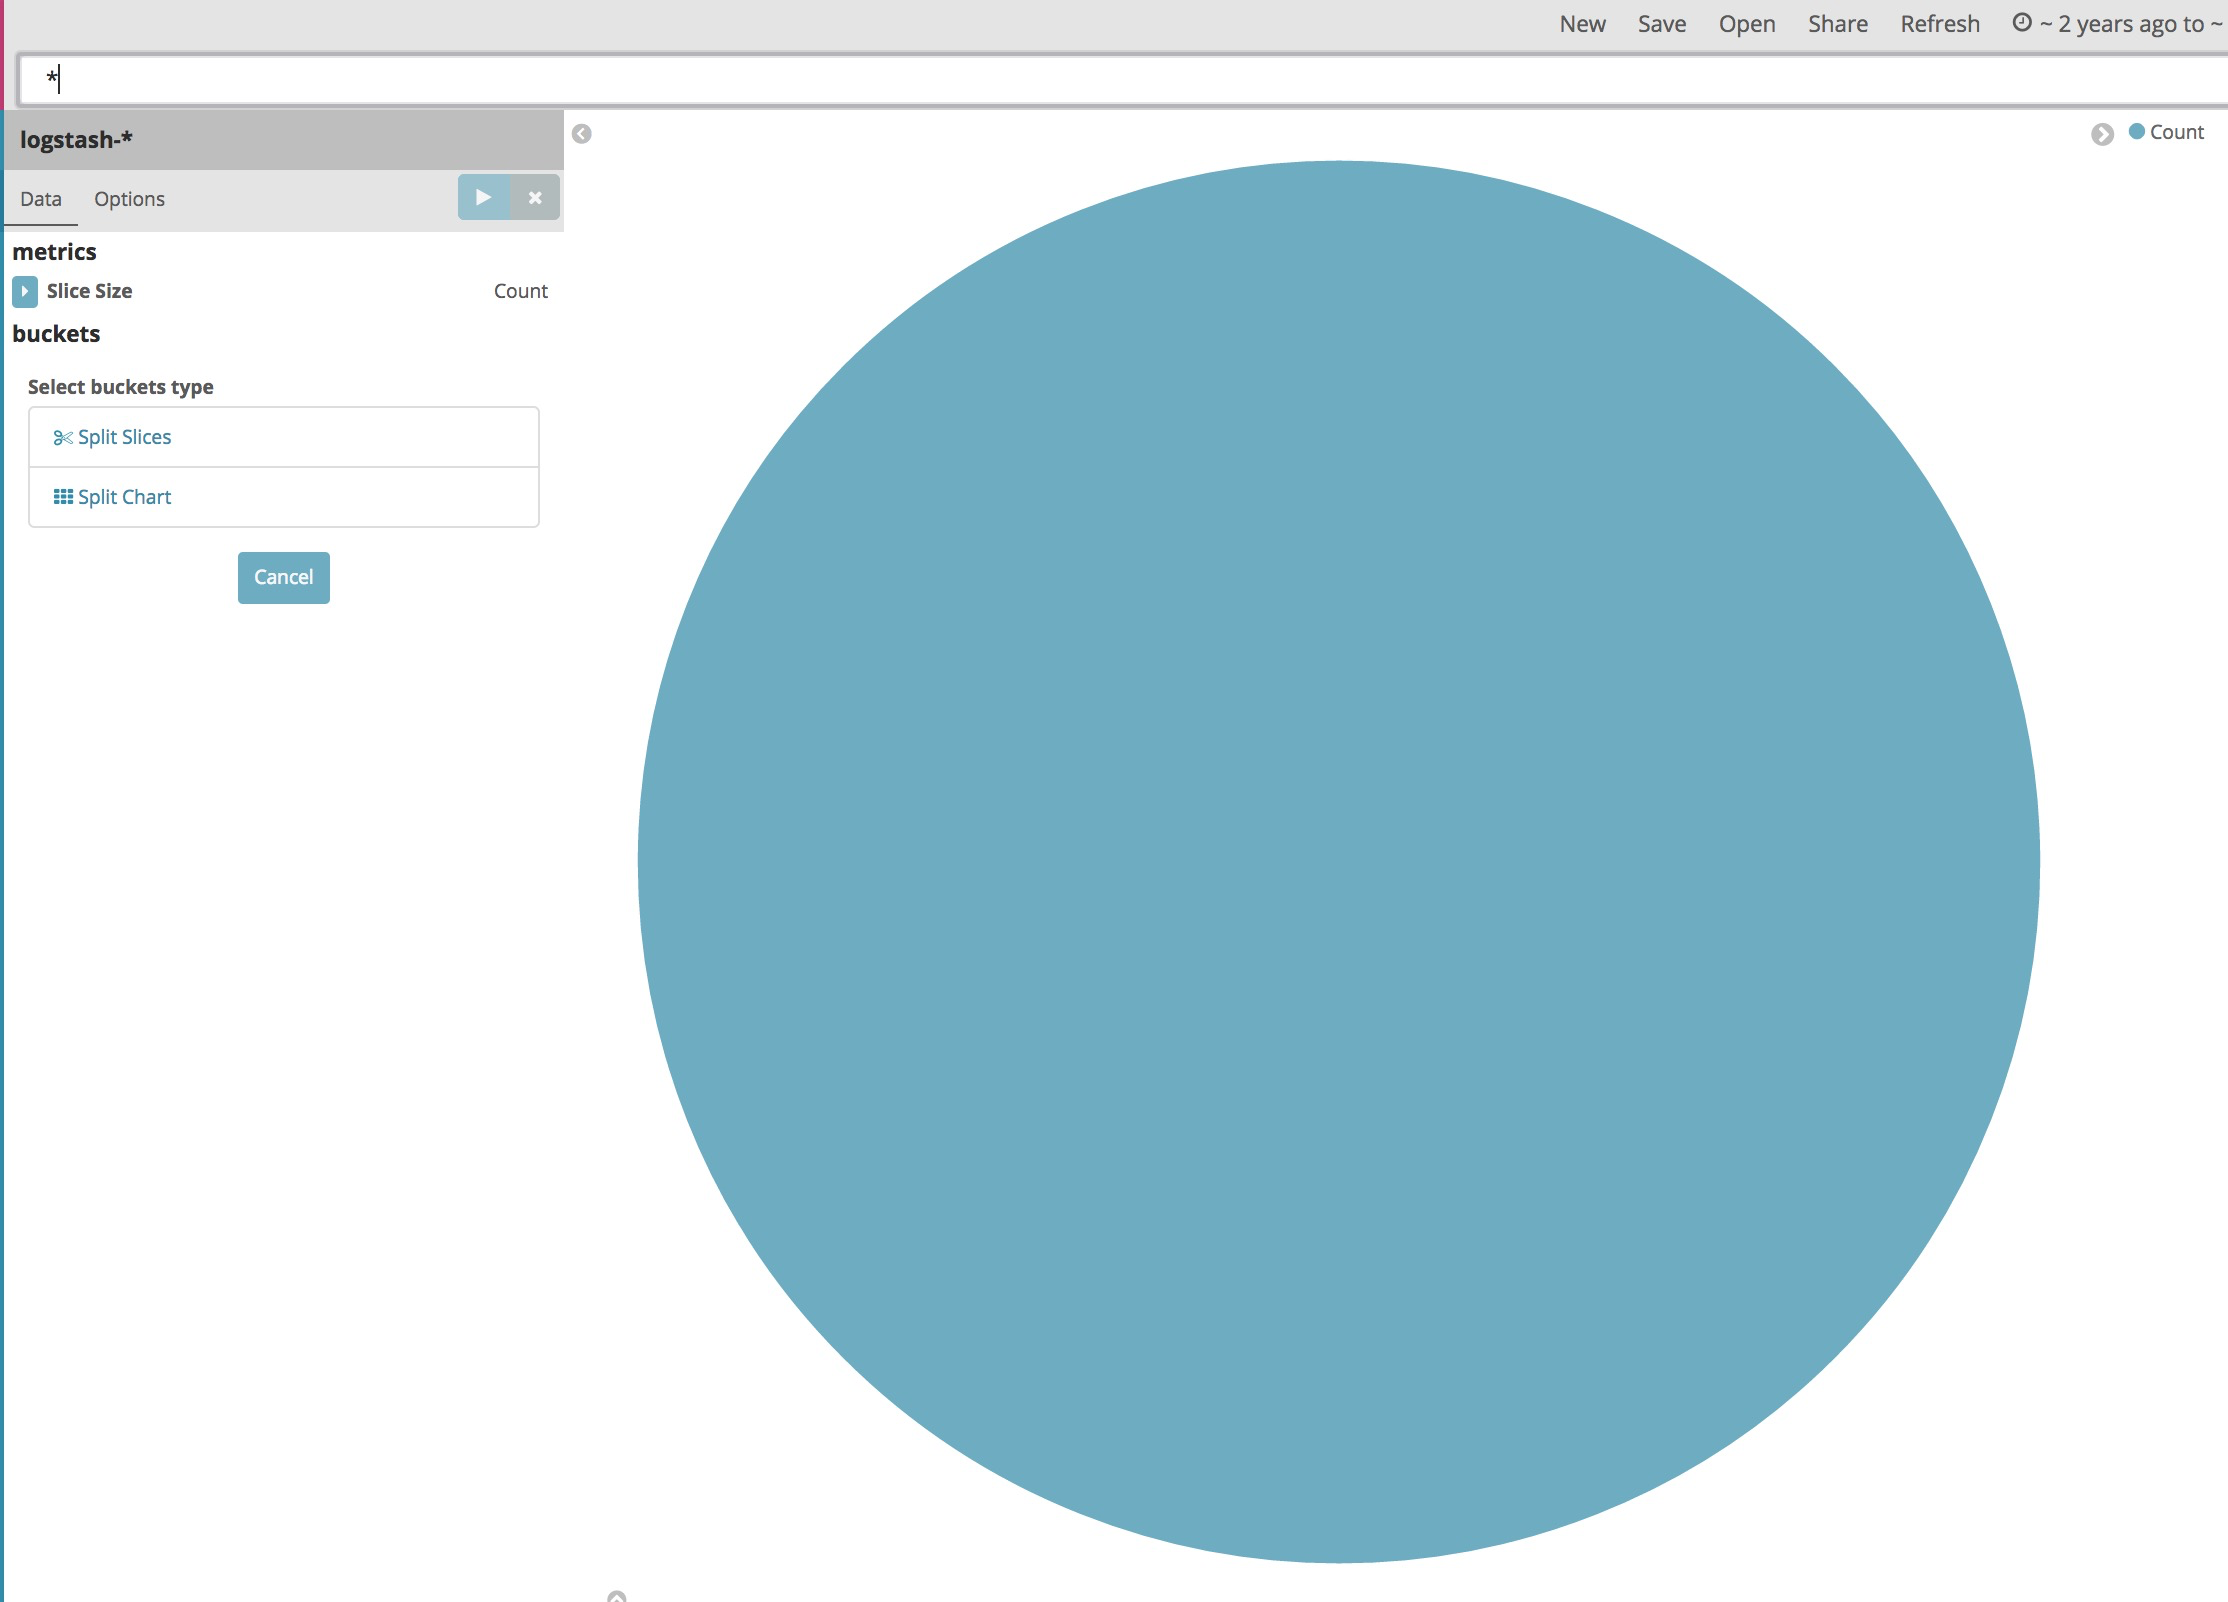
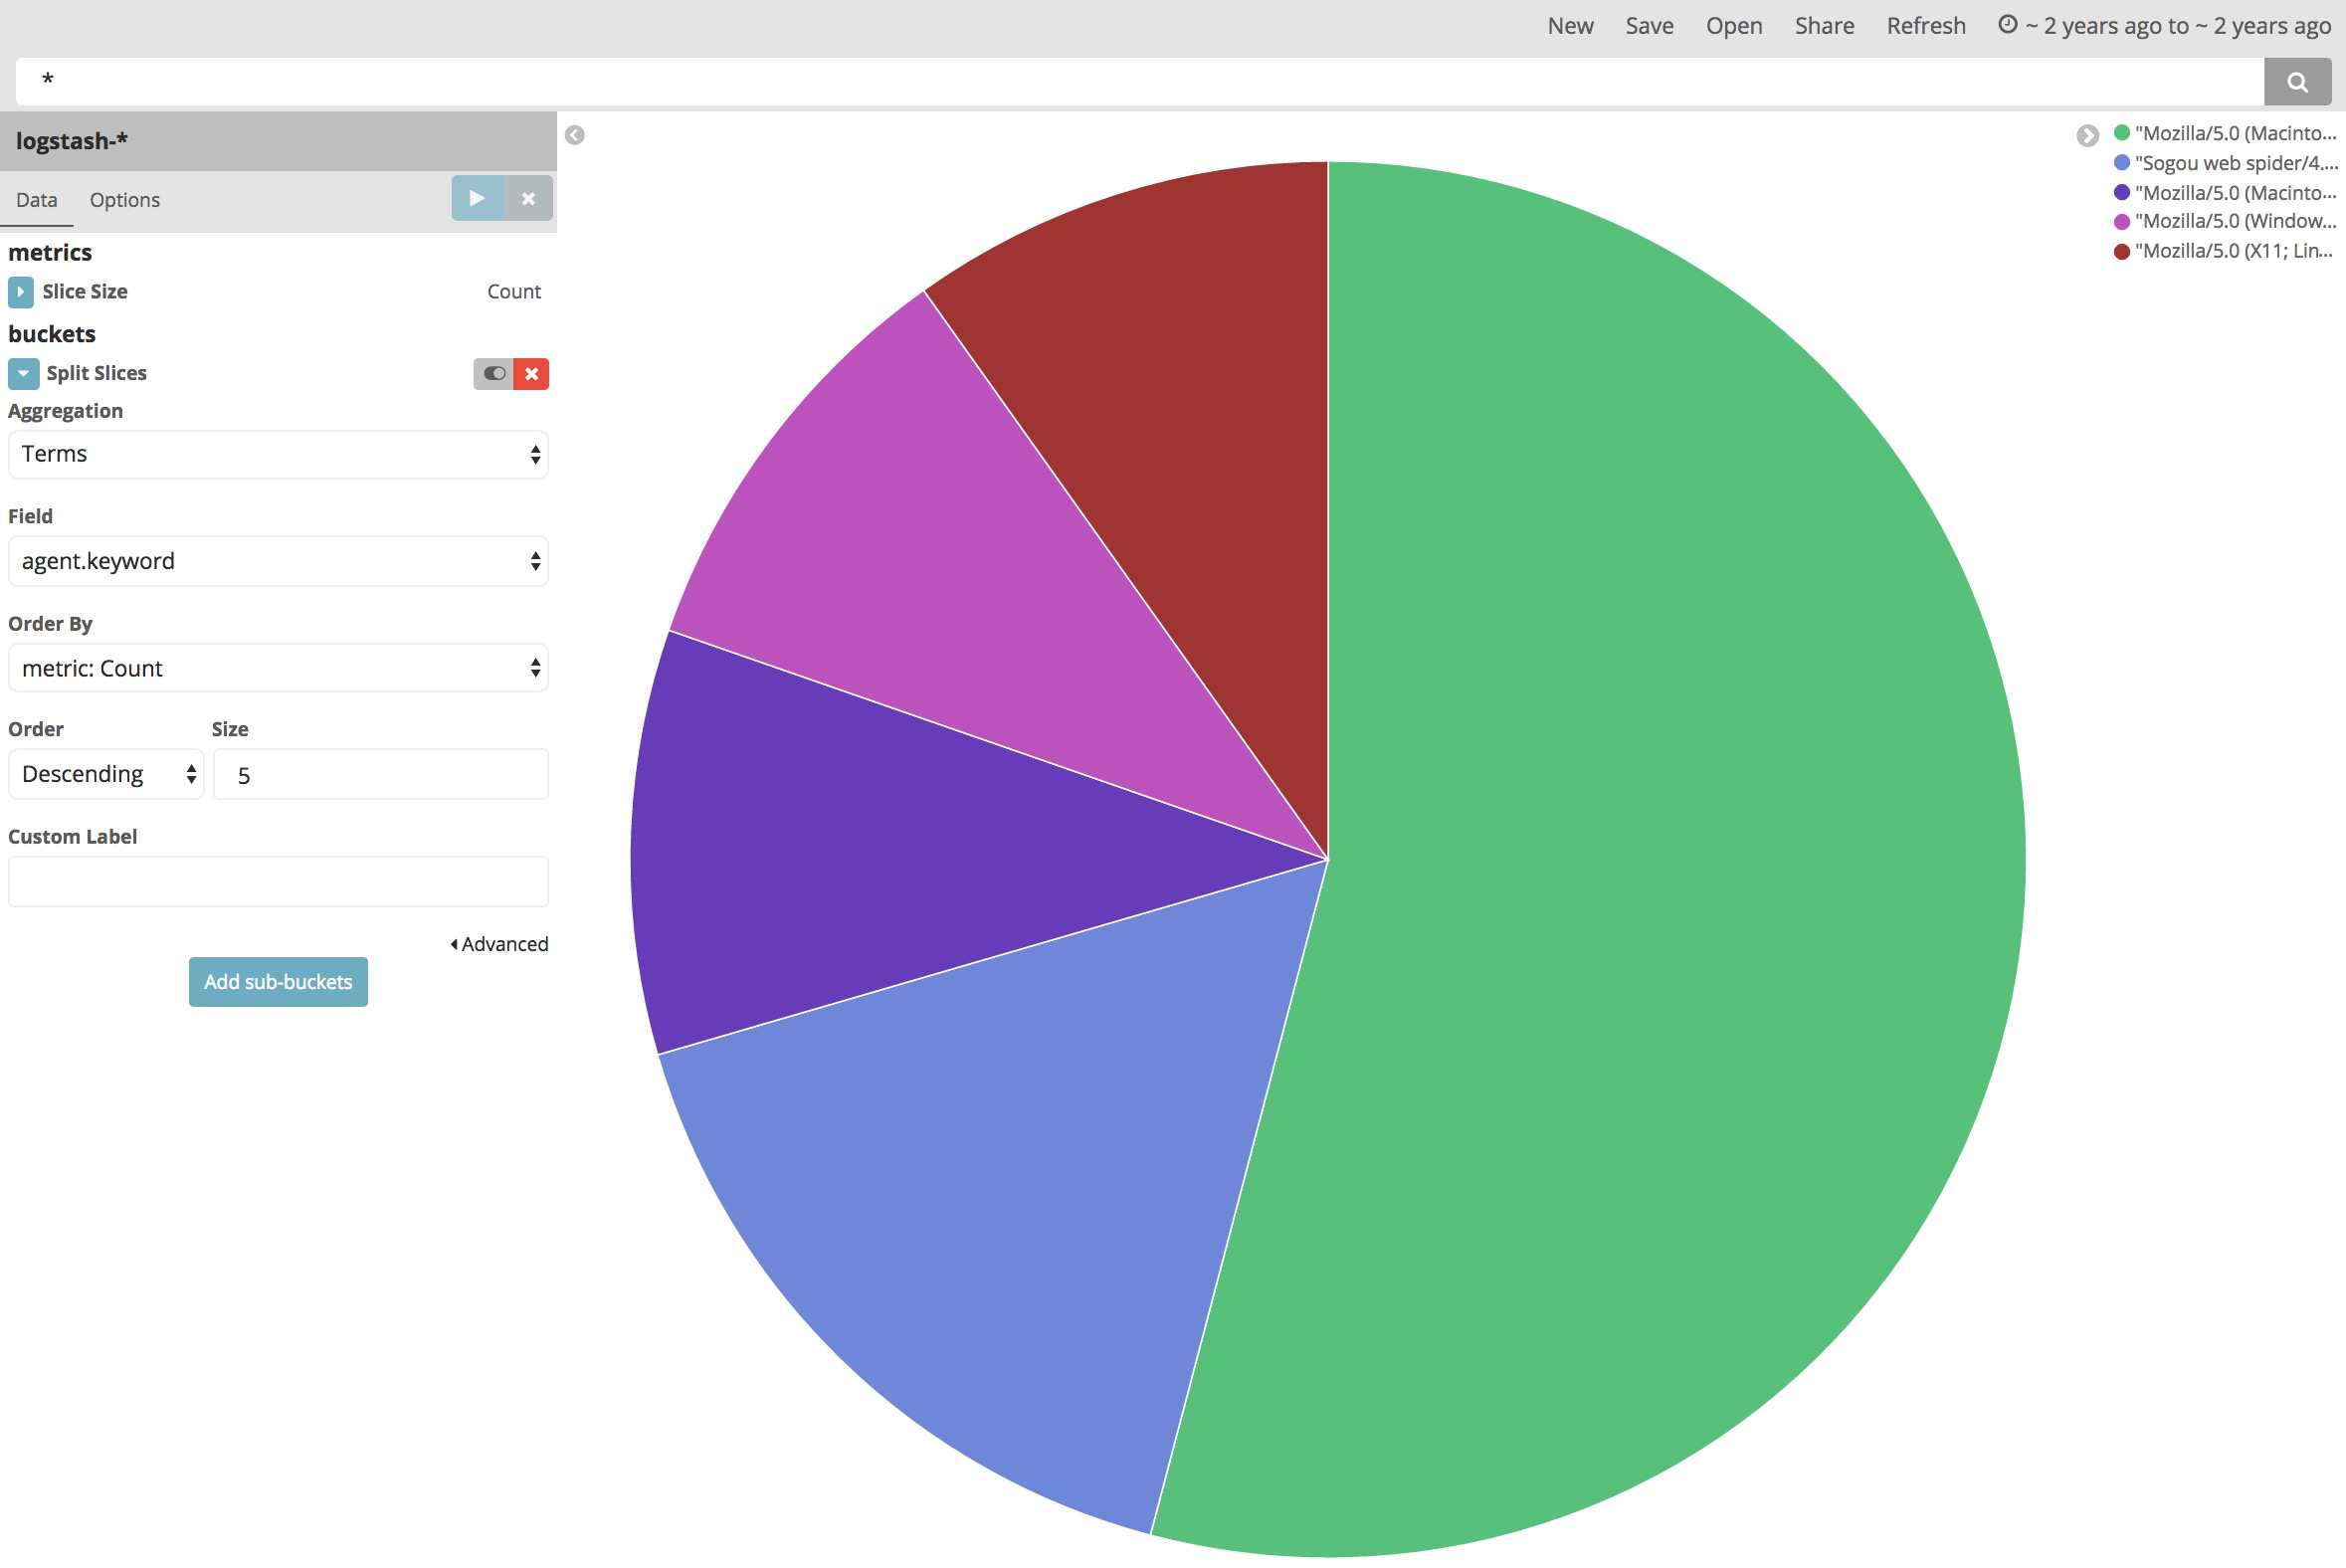
ここから、Split Slicesで、内訳を追加することができます。
例えば、Aggrigation=Terms, Field=agent.keyword, Order By=Count Size=5
この意味は、agent.keywordというフィールドに着目してグループ分けして、カウント数が大きい順から5つとってきて円グラフをスライスする、です。
まとめ
静的なファイルの読み込みができました。次は、ダイナミックに syslog や netflow を受け取って可視化していくための設定を作ってみます。(近日中に)